Fourth National Report on Human Exposure to Environmental Chemicals
Updated Tables, March 2021
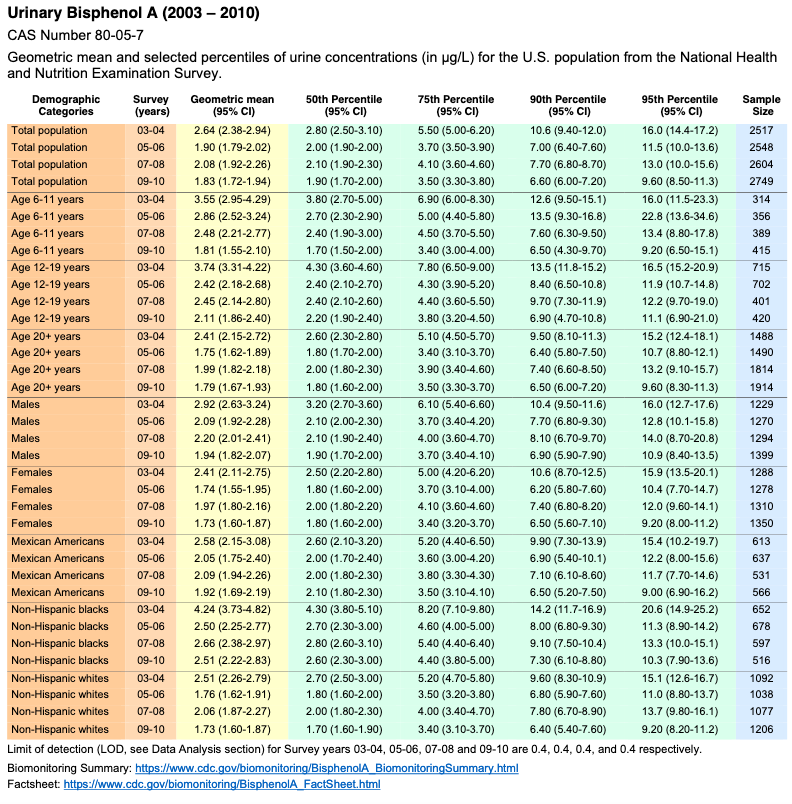
Geometric mean and selected percentiles of urine concentrations (in μg/L) for the U.S. population from the National Health and Nutrition Examination Survey.
Excerpted data. Selected full data tables follow
Volume One: NHANES 1999-2010
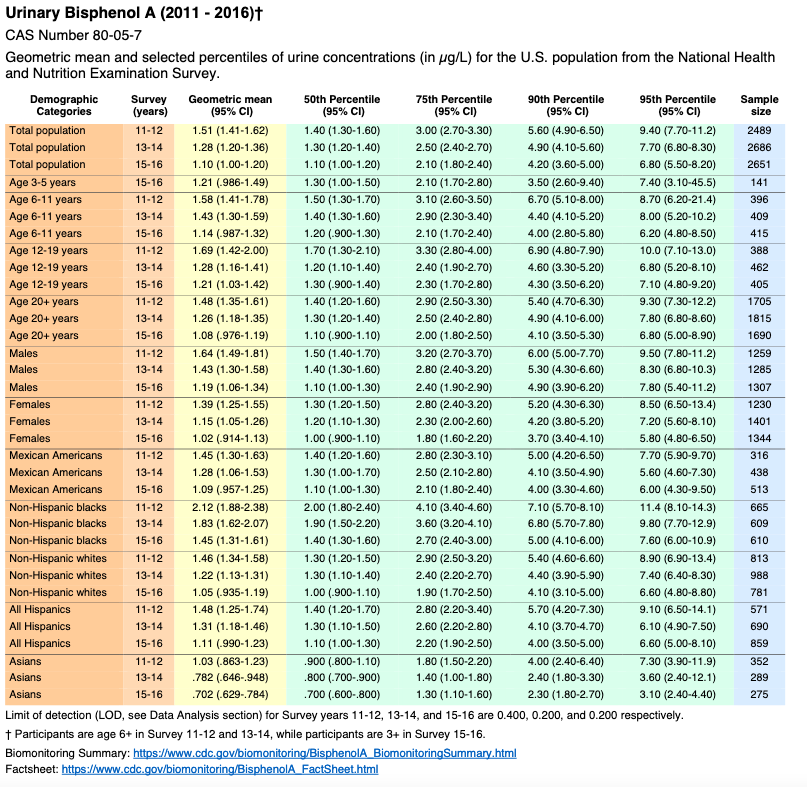
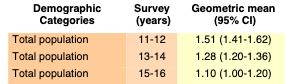
Bisphenol A
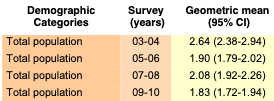
Bisaphenol F and S not monitored
Volume Two: NHANES 2011-2016
Bisphenol A
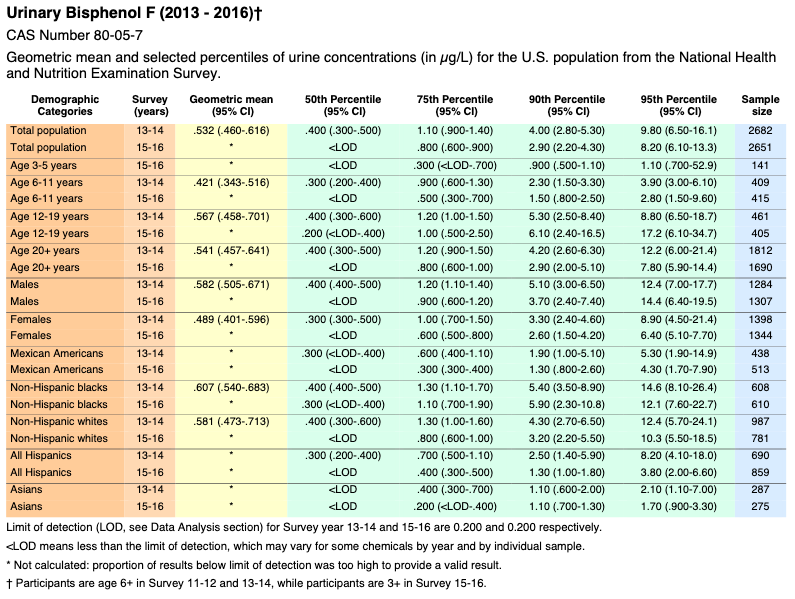
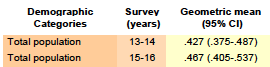
Bisphenol F
![]()
* Not calculated: proportion of results below limit of detection was too high to provide a valid result.
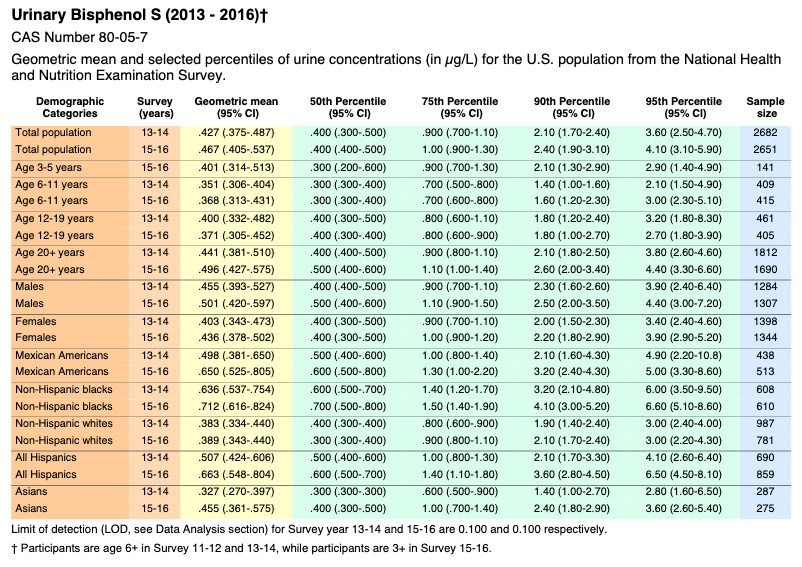
Bisphenol S
This ad-free article is made possible by the financial support of the
Center for Research on Environmental Chemicals in Humans: a 501(c)(3) non-profit.
Please consider making a tax-deductible donation for continued biomedical research.
Selected full data tables
Volume One: NHANES 1999-2010
Biomonitoring Summary: https://www.cdc.gov/biomonitoring/BisphenolA_BiomonitoringSummary.htmlFactsheet: https://www.cdc.gov/biomonitoring/BisphenolA_FactSheet.html
No monitoring data for Bisphenol F or Bisphenol S
Volume Two: NHANES 2011-2016
https://www.cdc.gov/exposurereport/pdf/FourthReport_UpdatedTables_Volume2_Mar2021-508.pdf
Biomonitoring Summary: https://www.cdc.gov/biomonitoring/BisphenolA_BiomonitoringSummary.htmlFactsheet: https://www.cdc.gov/biomonitoring/BisphenolA_FactSheet.html