PLEASE NOTE: A less technical version of this article, intended for non-scientists, can be found at this link.
Beta Version 4.7 — 03/06/24. This strength-of-evidence report card was developed by Lewis Perdue and will be updated and/or expanded as needed.
It is based upon the concept of evidence-based medicine which was developed to help clinicians interpret the strength of studies in order to practice the most credible and relevant methods for their patients/clients.
Many thanks to David Morrison for his able assistance with this post.
Strength of Evidence Criteria

Clinical Trials
Clinical trials are a type of interventional study in humans, not other species or in vitro. The “intervention” can be a drug, chemical, device, treatment or other process with a hypothesized outcome. A clinical study divides participants into two groups: one which receives the intervention and a control group that is otherwise similar but does not receive it.
Clinical trials have the highest quality of evidence. Proper clinical trials are registered with the National Institutes of Health, and can be searched by the public.
Strength: A+ — Systematic Reviews of multiple Randomized Controlled Trials (RCTs)
Comparing and reanalyzing the data of many peer-reviewed, Randomized Clinical Trials (RCTs) (see definition below) to determine whether their results are the same or similar. The best systematic, multi-study reviews create new data by combining data from the studies reviewed. More comparisons and greater similarities strengthen the evidence of results and conclusions. See: https://www.ncbi.nlm.nih.gov/pmc/articles/PMC5122273/
Peer Review – Definition
Peer review is a pre-requisite for credible studies. It means that a study has been examined by independent scientists for quality, competency and compliance with research standards.
Strength: A –Randomized, Blinded / Double-Blinded RCTs
Randomized means participants are assigned randomly to a control group or one receiving an intervention. Blinded means that none of the participants know whether they are in the control or intervention cohort. This prevents behavioral, psychological and placebo effects from influencing the outcome. Double-blinded means that participants (and their doctors) don’t choose which intervention they will get, or not get.
Strength: A- Randomization without blinding
Lack of blinding cause unaccounted-for complicating factors.
NOTE: The studies, below are types of observational studies
Observational studies do not provide causal data. However, they can provide links, connections, indications, or other potential relationships. This is because observational studies rely on existing data of varying quality relating to existing measured quantities such as blood pressure or a history of cancer, health habits such as exercise or diet, or environmental conditions like air and water quality.
It is important to realize that strict clinical trials are often not possible for ethical, legal, or other reasons. This is why observational studies — regardless of their lack of strict causality — can often be valuable for public and personal health decisions. The strength of evidence for these studies can hinge on the number of subjects, the quality of the protocol, and especially on whether the study has been replicated (and the number of replications.)
Strength: B+ Case-control studies
A case-control study starts with the selection of a group of individuals with a specific disease or syndrome of interest (outcome status) to the study and try to assess their risk factors. A second group of individuals (controls) are selected and compared with those who do not have the same specific disease or syndrome outcome status. Researchers then try to find differences between the groups in an effort to determine factors to help reduce the risk of the disease or syndrome. The researcher looks at historical factors to identify if whether some exposure(s) is/are found more commonly in the cases than the controls. If the exposure is found more commonly in the cases than in the controls, the researcher can hypothesize that the exposure may be linked to the outcome of interest. For more, see: https://pubmed.ncbi.nlm.nih.gov/28846237/ Case-control studies can establish a correlation between exposures and outcomes, but cannot establish causation because of unknown or uncontrollable confounding variables or exposures. Case control studies are similar to epidemiology.
Strength B: Cohort studies
Cohort studies (observational) Cohort studies are similar to case studies. The difference is often misunderstood. A case study begins with individuals currently suffering from a specific disease or syndrome and are studied over time.
By contrast, a cohort study begins with a set of people chosen because of a common factor: They all live in the same area, they all play tennis, drink wine (or not), etc. The group is then followed to examine a predetermined set of risk outcomes: cardiovascular, cancer, length of life, etc. By looking at the outcomes, researchers strive to determine specific risks that others may reduce or avoid.
The Framingham heart study is a prominent example of a longitudinal cohort cohort study.
Strength B- Cross-sectional Studies
Cross-sectional studies are a type of observational study design. In a cross-sectional study, the investigator measures the outcome and the exposures in the study participants at the same time.
Unlike in case–control studies (participants selected based on the outcome status) or cohort studies (participants selected based on the exposure status), the participants in a cross-sectional study are selected just based on the inclusion and exclusion criteria set for the study.
Once the participants have been selected for the study, the investigator follows the study to assess the exposure and the outcomes. Cross-sectional designs are used for population-based surveys, and to assess the prevalence of diseases in clinic-based samples.”
Caution from: https://pubmed.ncbi.nlm.nih.gov/29453895/: “[W]hen cross-sectional data is used for analytical purposes of associations between an exposure and an outcome, authors and readers should be careful not to make causal inferences [emphasis added] unless the exposure may safely be assumed to be stable over time and not influenced by experiencing the outcome. In such cases, analyses are also subject to selection and information bias as well as confounding. ”
Strength C+ Ecologic Studies and Natural Experiments
Results of Ecologic Studies and Natural Experiments cannot be applied to individuals.
“In an ecologic study, the unit of analysis is a group or aggregate rather than the individual. It may be the characteristics of districts, states, or countries. For example, per capita income across countries, income quintiles across districts, and proportion of college graduates in states.
If the data already exist (such as global measures and prevalence of diseases, data sets such as the National Family Health Survey, census data), then ecologic studies are cheap and the data are easy to collect. However, one needs to be aware of the “ecologic fallacy.”
The researcher should not interpret ecologic level results at the individual level.
Strength: C Preprints
Published pre-prints (such as MedRxiv) may be credible depending upon the study design (clinical, randomized etc.), the investigators, methods, and institutional affiliations. Some pre-prints are later published in peer-reviewed journals.
May provide useful indications needing further study.
Strength: C- Published Studies based on questionnaires and clinical record forms
Like preprint, may provide useful indications needing further study.
Below: Not clinical, not causal, but may indicate phenomena worth pursuing
Strength: D+ Animal Research
Significantly, most promising pharmaceuticals that show great promise and success with rats or mice ultimately fail in human trials. 96% of drugs deemed safe and effective in animals, fail final approval. On the other hand, mice, can be a useful indicator of a phenomenon worthy of further study. Why Mouse Matters.
Strength D In Vitro Studies
These are conducted using cells or tissues in laboratory apparatus to judge a chemical or biological intervention on a chemical or biological pathway. These may offer early indications of phenomena warranting further research.
Strength D- Low Evidence-Strength Study Types
Other Non-Causal or non-peer-reviewed studies include conference abstracts, posters and presentations. Also includes editorial and opinion pieces, even if they are written by credible scientists and/or appear in a quality journal. They offer food for thought or inspiration.
Strength F Sources of very limited strength
Anecdotes, personal opinion, narrative reviews, editorials. Lack identifiable measures of causality. The scientific equivalent of gossip.
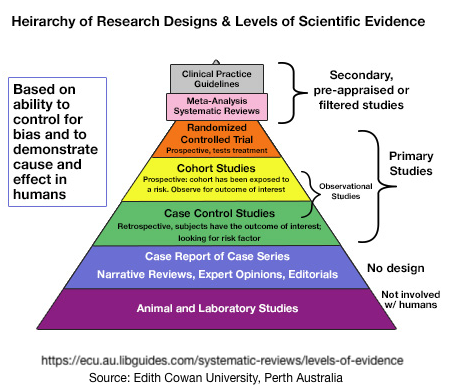
Graphically looking at the Strength of Evidence – One Example
Many efforts have been made to use pyramids to represent levels of scientific evidence among the various study designs. Most are incomplete.
Confounding Factors, Complications & Concerns
These are factors in the conduct of a study that decrease the strength of evidence and produce associations and links that are not causal.

The notations in (parentheses) are indexed to locations, below, and in the online mind map. For more on that, please scroll down for the mindmap link and directions for accessing it.
(C-SRD) Self Reported/Selected Data: Prevalent In Nutrition and Dietary Studies
Traditional Self-Reported Dietary Instruments Are Prone to Inaccuracies and New Approaches Are Needed — https://www.frontiersin.org/articles/10.3389/fnut.2020.00090/full — Self-reported data are frequently inaccurate because of memory issues recalling previous activities. Limitations in the assessment of dietary energy intake by self-report — https://www.sciencedirect.com/science/article/abs/pii/002604959590204X — This is complicated by social desirability/approval bias where participants in a study over- or under-estimate an activity or consumption of a food or beverage to conform to an amount that is seen as most socially acceptable. For instance, over-reporting green vegetable consumption or under reporting ultra-processed food sugar, fats or alcohol consumption.
(C-SRDa) Subject Confusion: What is a drink? Most people pour more than 1 standard drink or unit as their usual glass — https://onlinelibrary.wiley.com/doi/full/10.1111/acer.12046 Underestimating the Alcohol Content of a Glass of Wine — https://academic.oup.com/alcalc/article/51/5/609/1740043
(C-SRDb) Social Pressure/Desirability Approval Bias – Related to body weight, age, socio-economic status, and other social approval bias.– Effects of social approval bias on self-reported fruit and vegetable consumption: a randomized controlled trial — https://link.springer.com/article/10.1186/1475-2891-7-18
Social Bias: There Is No Safe Level of Alcohol — https://www.thelancet.com/journals/lancet/article/PIIS0140-6736(18)31310-2/fulltext
Under-Reporting of Alcohol Consumption — Because alcohol consumption is a hot-button public controversy, studies indicate that people under-report their actual consumption by 33% to 50 %. In addition, heavier drinkers under-estimate the most
Underreporting in alcohol surveys: whose drinking is underestimated?
How is alcohol consumption affected if we account for under-reporting? A hypothetical scenario
Social Bias: Ultraprocessed Food: Addictive, Toxic, and Ready for Regulation — https://www.mdpi.com/2072-6643/12/11/3401
Consumption of ultra-processed foods and associated sociodemographic factors in the USA — https://www.ncbi.nlm.nih.gov/pmc/articles/PMC5855172/
(C-SRDc) Confusion Example: Most Americans Don’t Know What ‘Ultra-Processed’ Foods Are: — https://www.health.com/most-americans-dont-know-ultra-processed-foods-7254891— Confusion in how to self-report. Ultra-processed food terminology not well known among U.S. consumers — https://www.foodnavigator-usa.com/Article/2023/02/24/ultra-processed-food-terminology-not-well-known-among-u.s.-consumers-ific-report –
(C-SRD/SSS) Registries
Some observational studies use patient registries which are an organized collection of data that patients agree to give.
Registry data is often less than precise and not representative of the general population. This is because people willing to be part of a registry are mostly self-selecting according to individual preference (or reluctance) to join the effort.
For example, one prominent registry, the U.K. Biobank, reports that their participants tend to be healthier than the general population.
In addition, some significant portions of these registries rely on subject-reported data which have been shown to be error-prone due to memory issues, embarrassment of frowned-upon substances or behaviors.
Self-selecting participants chronically under-report some behaviors such as those involving smoking, alcohol consumption, drug use, and unhealthy diets like ultra-processed foods.
Statistical methods such as Mendelian Randomization attempt to move these sorts of observational data more toward causality. The conclusions of causality calculated by Mendelian Randomization are controversial.
(CSSS) Self-selected subjects
Data may not be applicable to people in general: UK Biobank, big data, and the consequences of non-representativeness
Participation bias, self-selection bias, and response bias — https://www.jaad.org/article/S0190-9622(21)01129-4/fulltext
Self-Selection Bias: An Essential Design Consideration — https://www.frontiersin.org/articles/10.3389/fnut.2020.587983/full
Example — Comparison of Sociodemographic and Health-Related Characteristics of UK Biobank Participants With Those of the General Population — https://academic.oup.com/aje/article/186/9/1026/3883629
Technical Factors
These may be difficult for the non-scientist or non-medical person to determine. A physician or factulty member at a local university may be your best advisor.
(C-TF1) Published in a predatory journal. These have lower standards for the conduct of studies and a much higher rate of retracted studies.
— Predatory Journals: What They Are and How to Avoid Them
— The problem of predatory journals
(C-TF2) Mendelian Randomization
Mendelian Randomization (MR) is not a study type.
It is a statistical method applied to observational (non-causal) data to create an inference of causality. While MR can imply causality, that does not elevate it to the superior level of interventional data. Assertions of actual causality calculated by Mendelian Randomization are incorrect.
Dive deeper on MR:
— Mendelian randomisation for mediation analysis: current methods and challenges for implementation,
— Looking at the many ways a study can go wrong: The Mendelian Randomization by Millwood et al.: Observations and Expressions of Concern — https://stealthsyndromes.com/?p=3711
Are Mendelian randomization investigations immune from bias due to reverse causation? — https://link.springer.com/article/10.1007/s10654-021-00726-8
(C-TF3) Investigators lack expertise or experience related to the study subject
Nearly impossible for a non-scientist to detect and difficult even for them.
This often comes to life when articles have to be retracted.
These sometimes show up at Retraction Watch which maintains the world’s best study retraction database database.
Unfortunately that database is not configured for easy consumer searches.
(C-TF4) Protocol Bias: Subtle and/or unintended biases in the study protocol and conduct may influence the results or presentation of outcomes.
(C-TF4a) Funding Investigator Bias or investigators may have conflicts of interest. This is especially serious if not disclosed
(C-TF4b) Funding Sponsor Source Bias — Published studies are equivocal: Some show some indication of bias in favor of the sponsor, some not.
**Relationship between Funding Source and Conclusion among Nutrition-Related Scientific Articles — https://www.ncbi.nlm.nih.gov/pmc/articles/PMC1764435/ ** https://www.aafp.org/pubs/afp/issues/2013/1201/p746.html
** Nonindustry-Sponsored Preclinical Studies on Statins Yield Greater Efficacy Estimates Than Industry-Sponsored Studies — https://www.ncbi.nlm.nih.gov/pmc/articles/PMC3897361/
**Industry sponsorship and research outcome — https://www.cochrane.org/MR000033/METHOD_industry-sponsorship-and-research-outcome **Impact of Industry Sponsorship on Research Outcomes — https://www.aafp.org/pubs/afp/issues/2013/1201/p746.html
** The Influence of Industry Sponsorship on the Research Agenda — https://www.ncbi.nlm.nih.gov/pmc/articles/PMC6187765/
Example of an Actual Study Report For Expert Use

All of the text above is based on an extensive mind map which is graphically presented for context and perspective. Text in the mindmap has been updated and amended in this post.
A much more readable and navigable version of the mind map — at this link — allows you to resize it to fit your computer screen. See directions below the image to learn how to adjust the sizing tool to 60% for a good beginning magnification.

